Key Performance Indicators (KPIs) using Analysis Services
In business terminology, a KPI is a quantifiable measurement for gauging business success. In Analysis Services, a KPI is a collection of calculations that are associated with a measure group in a cube that are used to evaluate business success. Typically, these calculations are a combination of Multidimensional Expressions (MDX) expressions or calculated members. KPIs also have additional metadata that provides information about how client applications should display the results of the KPI’s calculations
Common KPI Terms:
- Goal – An MDX numeric expression or a calculation that returns the target value of the KPI.
- Value – An MDX numeric expression that returns the actual value of the KPI.
- Status – An MDX expression that represents the state of the KPI at a specified point in time. The status MDX expression should return a normalized value between -1 and 1. Values equal to or less than -1 will be interpreted as «bad» or «low.» A value of zero (0) is interpreted as «acceptable» or «medium.» Values equal to or greater than 1 will be interpreted as «good» or «high.»
- Trend – An MDX expression that evaluates the value of the KPI over time. The trend can be any time-based criterion that is useful in a specific business context. The trend MDX expression enables a business user to determine whether the KPI is improving over time or degrading over time.
- Status indicator – A visual element that provides a quick indication of the status for a KPI.
- Trend indicator – A visual element that provides a quick indication of the trend for a KPI.
- Display folder – The folder in which the KPI will appear when a user is browsing the cube.
- Parent KPI – A reference to an existing KPI that uses the value of the child KPI as part of computation of the parent KPI. Sometimes, a single KPI will be a computation that consists of the values for other KPIs.
- Weight – An MDX numeric expression that assigns a relative importance to a KPI. If the KPI is assigned to a parent KPI, the weight is used to proportionally adjust the results of the child KPI value when calculating the value of the parent KPI.
Creating KPIs using Business Intelligence Development Studio (BIDS)
- Click on the KPIs tab
- We shall first add a KPI named ProfitPercentage to the cube:
- Click on the New KPI button or right-click on the KPI Organizer window and select New KPI.
- In the KPI Designer which opens up, type in the name of the KPI asProfitPercentage.
- Add the measure to the Sales Fact measure group by selecting from the Associated measure group drop down.
- Now let’s add an expression to evaluate the value property of the KPI:
- Type the following expression in the Value Expression box. You could also drag the measures from the Metadata tab in the Calculation tools window.
[Measures].[Profit]/[Measures].[Product Cost]
OR
([Measures].[Sales Amount]/[Measures].[Product Cost]-1
We have built the expression above using the logic that ProfitPercentage is calculated as the difference in Sales and Cost, divided by the Cost.
Here [Measures].[Profit] is Calculated Member using below calculation:
CREATE MEMBER CURRENTCUBE.[MEASURES].[Profit]
AS SUM
(
[Date].[Calendar Year – Qtr – Month].currentmember,
[Measures].[Sales Amount]-[Measures].[Product Cost]
),
FORMAT_STRING = «#,#»,
VISIBLE = 1;
- Type the following expression in the Value Expression box. You could also drag the measures from the Metadata tab in the Calculation tools window.
- Now, let us set the goal of the KPI to a constant. Enter 0.25 in the Goal Expression box, which means the goal expects 25% more in sales than the cost.
- Next we are on to the all important status. Here we shall write an expression to compare the value with the goal:
- Before examining the actual expression let us take a look at a pseudo-expression:
CASE
WHEN value/goal >= 0.9 THEN 1
WHEN value/goal < 0.8 THEN -1
ELSE 0
END
Here, a ratio of .9 would be considered good in this instance. This means that if the value makes up at least 90% of the goal then it would be considered as successful, hence the value 1 to indicate it. If value/goalequals to less than 0.8 then the status will be considered as a failure (-1). And all those values do not fall into the above ranges will be considered neutral (0).
Now, enter the following MDX expression into the Status expression box:
CASE
WHEN KPIValue(«ProfitPercentage»)/KPIGoal(«ProfitPercentage»)>=.9THEN 1
WHEN KPIValue(«ProfitPercentage»)/KPIGoal(«ProfitPercentage»)< .8THEN -1
ELSE 0
END
Being the realization of the previous «pseudo-expression», the above expression replaces value with KPIValue(«ProfitPercentage») and goal withKPIGoal(«ProfitPercentage»). The KPIValue function returns the value of the KPI’s value property, while the KPIGoal function returns the value of the KPI’s goal property. Both functions take the name of the KPI through a character string parameter.
- Before examining the actual expression let us take a look at a pseudo-expression:
- Select an appropriate image type from the Status indicator drop down to provide for the visuals of the KPI status.
- The next property to be configured is the trend. Once again, let us first look at a «pseudo-expression»:
CASE
WHEN IsEmpty(x) THEN 0
WHEN v – vX >= 0.25 THEN 1
WHEN v – vX < -0.1 THEN -1
ELSE 0
END
Here, x is the current time period of the previous year. For instance if the current selected time period is 20-May-2008, x will be 20-May-2007. v is the value of the KPI, which by default would return the value for the current time period. vx is the value of the KPI for the same time period of the previous year. The expression first checks if x is empty, thereby resulting in 0 (or no change in trend). Then, it checks if the current period’s value is an increase of at least 25%, thereby indicating 1 or a positive trend. If there’s a decrease of more than 10% from last year it indicates a negative trend or -1. All other results will indicate no change in the trend (or 0).
Enter the following MDX expression in the Trend expression textbox:
CASE
WHEN IsEmpty(ParallelPeriod([Date].[Calendar Year – Qtr – Month].[Calendar Year], 1,[Date].[Calendar Year – Qtr – Month].CurrentMember)) THEN 0
WHEN KPIValue(«ProfitPercentage»)-(KPIValue(«ProfitPercentage»),ParallelPeriod([Date].[Calendar Year – Qtr – Month].[Calendar Year],1,[Date].[Calendar Year – Qtr – Month].CurrentMember)) >= 0.25
THEN 1
WHEN KPIValue(«ProfitPercentage») – KPIValue(«ProfitPercentage»),
ParallelPeriod([Date].[Calendar Year – Qtr – Month].[Calendar
Year],1,[Date].[Calendar Year – Qtr – Month].CurrentMember)) < -0.1 THEN -1
ELSE 0
END
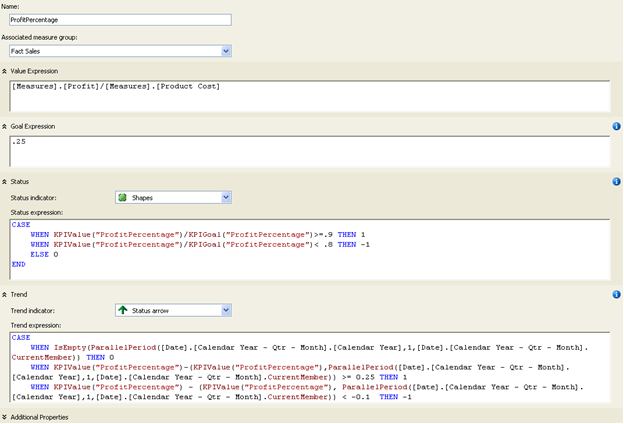
In the MDX expression above, x is replaced by ParallelPeriod([Date].[Calendar Year – Qtr – Month].[Calendar Year], 1,[Date].[Calendar Year – Qtr – Month].CurrentMember) ParallelPeriod is a function which returns a member from a prior period in the same relative position as a specified member. The variable v is replaced by KPIValue(«ProfitPercentage») and vx is replaced by (KPIValue(«ProfitPercentage»), ParallelPeriod([Date].[Calendar Year – Qtr – Month].[Calendar Year], 1,[Date].[Calendar Year – Qtr – Month].CurrentMember)). - Select an appropriate image type from the Trend indicator drop down to provide for the visual of the KPI trend. Here’s a sample of what the KPI designer should look like:

-
The KPIs is done! Next, process the cube. You will be able to view the KPIs using the built-in KPI Browser under the KPIs tab in BIDS. You could also use Office 2007 Excel.


Fuente: http://sql-bi-dev.blogspot.com/2010/05/key-performance-indicators-kpis-using.html
Publicado el 15 noviembre, 2011 en Inteligencia de negocios. Añade a favoritos el enlace permanente. 4 comentarios.

whoah this blog is wonderful i love reading your posts.
Keep up the great work! You understand, lots of individuals are hunting around for this information, you can help
them greatly.
Experience Nepalese life as it happens within this city by experiencing and enjoying the scenery
in Bhaktapur Durbar Square and Potter. What you must remember with classified ads is you can keep them short, attention-grabbing making them want to find
out more. Previously, torrents were utilised only by those highly internet and
computer savvy individuals.
For more details please visit our site to club penguin field ops or Click here.
You can buy the furniture and clothes and are given prime importance when it comes
to inclusion of new features. Kaboose – – A fun website focused
on providing games «for moms and kids».
What’s up i am kavin, its my first time to commenting anyplace, when i
read this article i thought i could also create comment due to this brilliant piece of writing.